The fans spun up one morning and never wound down. I had a couple of Claude Code sessions deep in different repos, a local model resident under Ollama so an agent could review diffs without leaving the machine, a llama.cpp experiment I had forgotten about, and another agent grinding through dependency updates in the background. Somewhere under all of that, a headless Chrome that no living process owned had quietly claimed itself as my default link handler. Every URL I clicked opened in a browser with no window.
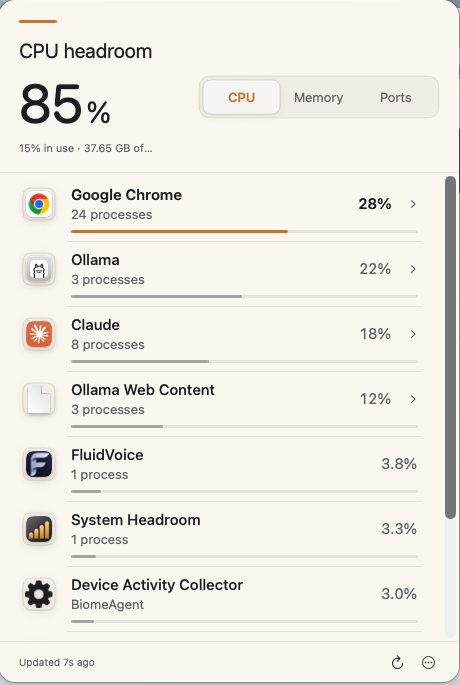
None of these programs was misbehaving, exactly. Each one was doing the job I gave it. The problem was that I could no longer see the whole, and macOS was not helping. Activity Monitor answers "what is my Mac doing" with four hundred rows, fourteen of them named Google Chrome Helper (Renderer). What I wanted fit in a glance: the top 10 things spending my CPU and memory, each app collapsed to a single line, and a way to stop the runaways that had outlived their purpose.
So I built it. It is called System Headroom, it is live on the Mac App Store as of this week, and the story of building it is mostly the story of what Apple's App Sandbox will and will not tell you.
Why I still ship
By day I lead cloud, platform, and DevOps engineering for a few hundred engineers. My calendar is mostly architecture reviews, vendor negotiations, and the slow work of keeping a big organization moving. On nights and weekends I ship my own apps, and I have since 2014. The habit keeps my judgment honest about what building actually costs, and it keeps me close to the people who do it all day.
I do not pretend a one-person Mac app is equivalent to shipping software inside a large enterprise. It is not. But the mechanics are close enough to keep certain muscles from atrophying: turning an idea into a brief, discovering where the platform disagrees with you, debugging what only appears under real use, deciding what not to ship, and eventually putting something in front of people. Those experiences make me more careful when I ask teams to move faster, simplify a design, or accept a platform constraint.
I also wrote a book arguing that the bottleneck is never the stack. This project handed the stack a whole summer to argue back, syscall by syscall.
Ten rows, not four hundred
The design brief fit in a paragraph. A menu bar app you glance at and close. The top 10 CPU consumers and the top 10 memory consumers, with every process that belongs to one app folded into a single row. No Dock icon, no accounts, no third-party dependencies, and no network access at all. A system monitor that phones home becomes one more process you have to monitor.
There is a small irony in the build itself. The first file in the repository is the written brief I handed to Claude Code. The same class of tools that buried my machine in processes helped me build the thing that watches them. It turns out a decade of writing one-page briefs for engineering teams is direct training for writing one-page briefs for agents. An agent is an unforgiving reader, and vague sentences come back as vague software.
The stack is deliberately boring: SwiftUI's MenuBarExtra on macOS 14 and later, Swift 6 with strict concurrency checking turned all the way up. The interesting parts were never going to be the UI.
The sandbox says no, with receipts
A Mac App Store app lives inside the App Sandbox, and the sandbox has opinions about process snooping. Before writing any app code, I ran a feasibility spike that called every relevant syscall against every class of process and recorded what came back. That file, SANDBOX_NOTES.md, became the most valuable document in the repository. It settles arguments, mostly with myself. It is the same move I ask of teams at work: when a debate keeps coming back, replace opinion with measurement and let the errno talk.
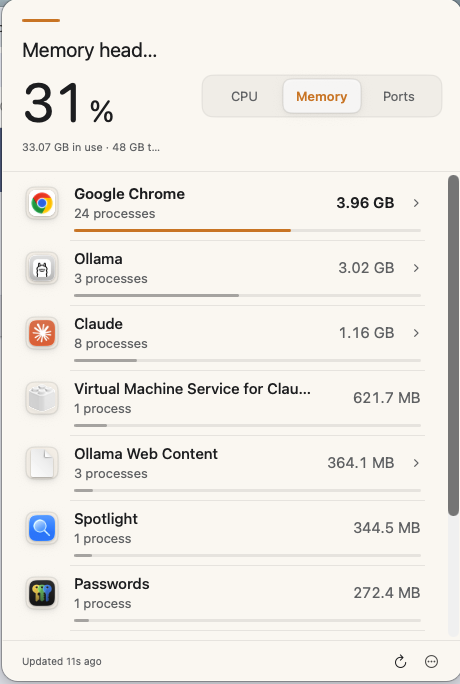
Here is what it settled. A sandboxed process can read the process table through sysctl. For anything running as the same user, proc_pidinfo will report CPU ticks and resident memory size. Root's processes and other users' processes are invisible entirely. And the memory number Activity Monitor shows, physical footprint, comes from an API that returns EPERM for every process except your own.
That last one forced the first real product decision. I could not match Activity Monitor's memory column, so I stopped trying. System Headroom reports resident size, the notes document exactly why, and the divergence is a settled decision instead of a recurring bug report to myself. Measured constraints beat aspirational ones.
Grouping is the product
The kernel gives you processes; people think in applications. The gap between the two is the product.
The kernel gives you process names 16 characters at a time. That is MAXCOMLEN, the size of p_comm in kinfo_proc, and it is why raw tools show you entries like "Google Chrome He". Any grouping logic has to survive truncation.
The engine resolves each process to its owning app in three steps: walk the parent-pid ancestry until it reaches a known app, then strip " Helper" style suffixes from the name, then fall back to treating the process as standalone. It is pure Swift with no syscalls in it, which means the whole thing runs against fixtures in tests. Chrome and its helpers become one row; on my machine this morning, that is twenty-four processes. So does an agent and the process tree it spawned.
That translation matters more than the raw numbers. A system monitor can be perfectly accurate and still be cognitively expensive. I did not want a better process table; I wanted a useful answer to a simpler question: what is consuming my machine right now?
Bugs that only a live app can teach
Three bugs made it past me into a running build, and each one taught me something about the platform. None of them would have reached me in a status update. Bugs like these introduce themselves only when someone is actually using the software, which is one reason I still hold the keyboard myself.
The first was a CPU reading a thousand times too high. The sampler is an actor, and I was capturing the tick timestamp before hopping into it. Under contention the hop got delayed and the elapsed time between samples approached zero. Dividing accrued CPU ticks by almost nothing produced readings in the thousands of percent. The fix was a rule, not a patch: the actor owns the clock and takes every timestamp inside it, next to the sweep. A burst test now hammers the sampler to keep that rule honest.
The second was a popover that refused to grow. MenuBarExtra's window style measures its panel once, at open, before the first sample has landed, and never resizes it. My list arrived a half second later into a window sized for nothing. The fix inverts the dependency: the list region has a fixed height whether it holds zero rows or ten, and a layout test asserts that an empty store and a full one measure identically.
The third was two copies of the app in the menu bar, because I relaunch constantly during development. Now every launch broadcasts a takeover notice over DistributedNotificationCenter, and older instances quit when they hear it. The newest launch always wins, which turns redeployment into "build and open."
The ports detour
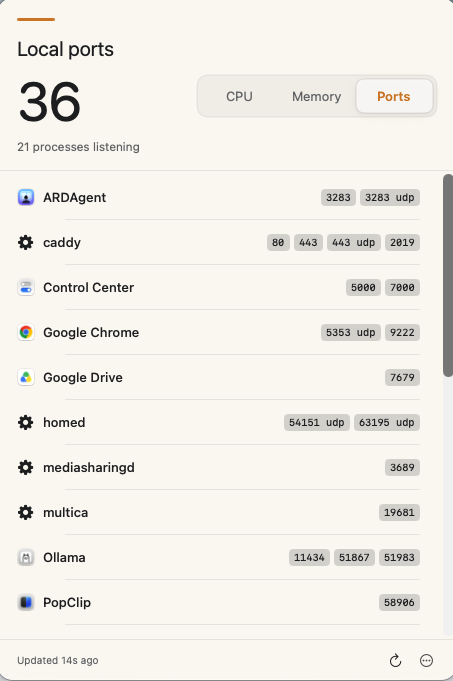
Once the app could tell me who was eating the CPU, I wanted one more view: who is listening on which port. A surprising number of the runaways I care about are development servers somebody forgot.
The obvious approach is the lsof one, walking file descriptors per process. The sandbox returns EPERM for every process but your own. My test plan, binding a port myself and checking the app saw it, died the same way: bind() is EPERM outright. What works is asking the kernel for the whole TCP and UDP tables through the net.inet pcblist_n sysctls. Parsing them means structures copied from the xnu headers and packed exactly as the kernel emits them. The live test's oracle is netstat: the app and the tool must agree on the listening set.
It is not glamorous code, but it turns another noisy system detail into something I can understand in a glance.
The feature that could not ship
Here is the punchline the sandbox saved for last. The reason I started this project was the kill switch: find the orphan, click, done. The App Sandbox denies every path to terminating another process. The polite AppKit call fails, the POSIX signal fails, the scripting route fails. I measured each one and wrote the results down next to the others.
And the sandbox is right. An app you downloaded from a store should not be able to reach over and kill your other software. The security model turned out to be the answer rather than the obstacle, and it split the product cleanly in two.
So System Headroom ships as two editions built from one codebase, with a single compile-time flag between them. The Mac App Store edition is fully sandboxed and monitors only; the quit controls are capability-gated and do not exist in that binary. The Direct edition is Developer ID signed, notarized, and unsandboxed. It adds Quit and Force Quit, reports physical-footprint memory that matches Activity Monitor, and updates itself with Sparkle. The Direct build runs on my own Mac today, and the delivery pipeline for everyone else is built and waiting on one more conversation with Apple.
Rejected for the pun
The app was not always called System Headroom. I named it Mac Headroom, because a machine overrun by chattering AI processes deserved a nod to Max Headroom, the stuttering synthetic TV host of the 1980s. I was proud of that name.
App Review was not. Guideline 5.2.5: you do not put "Mac" in a product name. The rejection arrived, the rename took a day, and the resubmission went through. Apple applies the rule evenly and I have no complaint. My organization reviews other people's work all day. It is healthy to have a finding land in my own inbox once in a while and to simply fix it. I did keep the domain, though. The pun lives on at macheadroom.com.
Shipped
Version 1.0 is live on the Mac App Store now. The headline number is the one the name promises: how much machine you have left. Below it, the app shows the top 10 CPU and memory consumers grouped by app, lists every local listening port, explains what each mystery daemon is in a built-in glossary, and leaves your network untouched because it has nothing to say to anyone.
The sandbox never shrank this app. It drew the floor plan. Every constraint that started as an obstacle ended as a product decision: the memory metric, the grouping design, the ports implementation, the two-edition split. If you are building on someone else's platform, measure the walls before you draw anything, write the errno down, and let the platform tell you what the honest version of your idea is.
Shipping it also paid the day job back. When an engineer tells me the platform will not allow something, I now know what a measured no looks like. I spent a summer collecting them. The sandbox won nearly every argument we had, and the app is better for each loss. My book claims the bottleneck is never the stack, and this summer the stack agreed.
The runaways, meanwhile, have not gone anywhere. As I wrote this, a dependency agent finished its run and left a node process idling where a build once ran. This time I saw it in seconds. That is the whole app.
Related reading
- Claude Code Is a Build System, Not a Chatbot: the six principles behind the daily practice that produced this app's first file.
- The Frontier on Your Laptop: the local models from this essay's opening scene, and how to run your own.
- Where the Saved Hour Goes: what people actually do with the time AI hands back. This app is one of my answers.
- The Bottleneck Is Never the Stack: the thesis the sandbox spent a summer testing.